| Iris Flowers | ||||
| These are some beautiful species | ||||
| Sepal.Length | Sepal.Width | Petal.Length | Petal.Width | Species |
|---|---|---|---|---|
| 5.1 | 3.5 | 1.4 | 0.2 | setosa |
| 4.9 | 3.0 | 1.4 | 0.2 | setosa |
| 4.7 | 3.2 | 1.3 | 0.2 | setosa |
| 4.6 | 3.1 | 1.5 | 0.2 | setosa |
| 5.0 | 3.6 | 1.4 | 0.2 | setosa |
| 5.4 | 3.9 | 1.7 | 0.4 | setosa |
Exploring the Iris Dataset
This story explores the famous Iris dataset using R and ggplot2.
Let’s explore the Iris flowers dataset.
The Iris dataset contains measurements of sepal length, sepal width, petal length, and petal width for 150 iris flowers, along with their species. It’s a classic dataset for classification and data exploration.
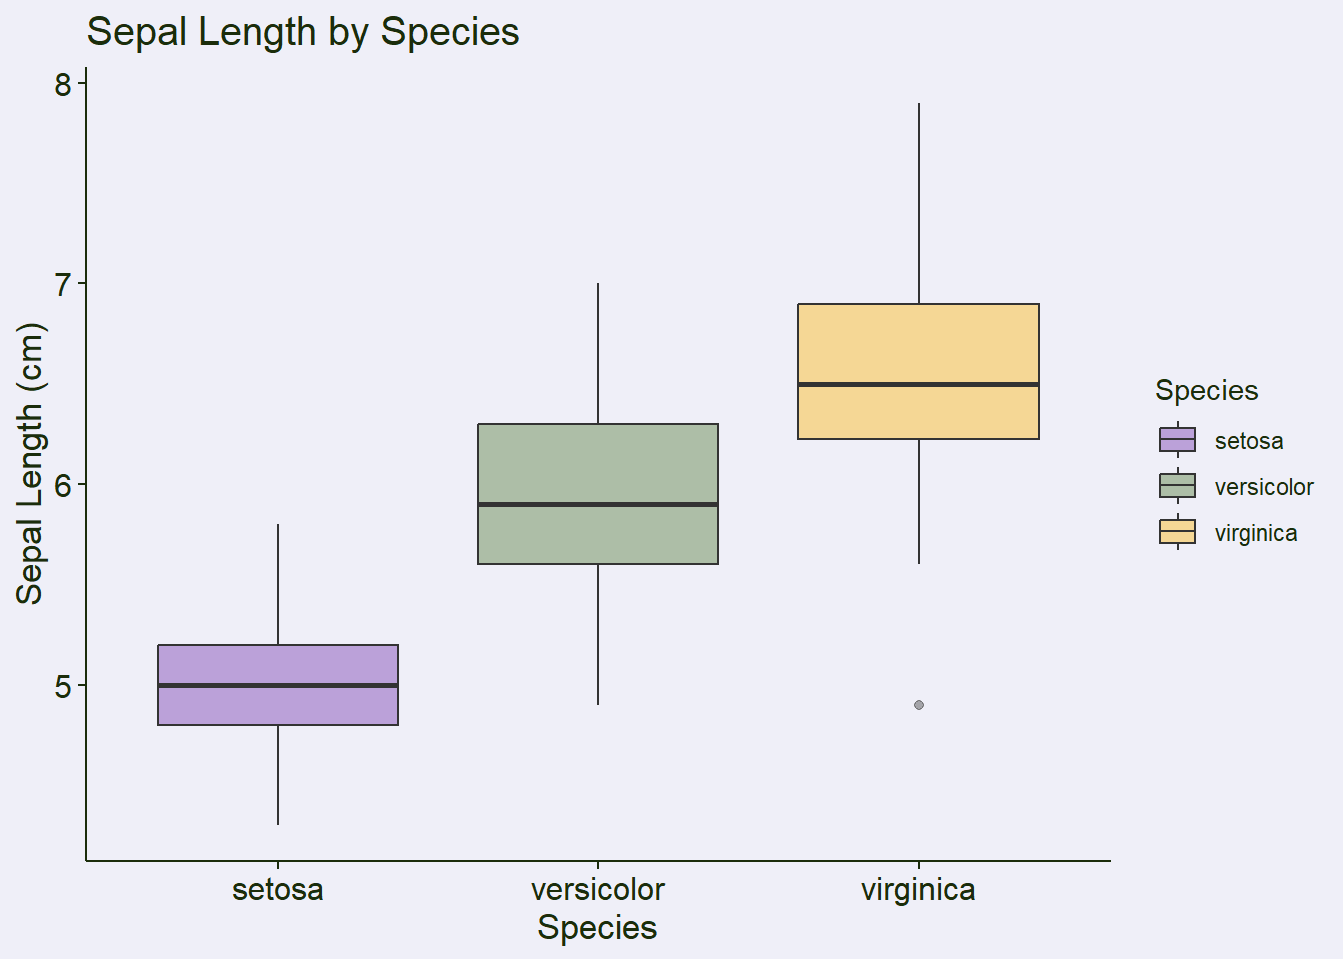
Let’s start by visualizing the distribution of sepal length for each species. We can see that setosa generally has shorter sepals than versicolor and virginica.
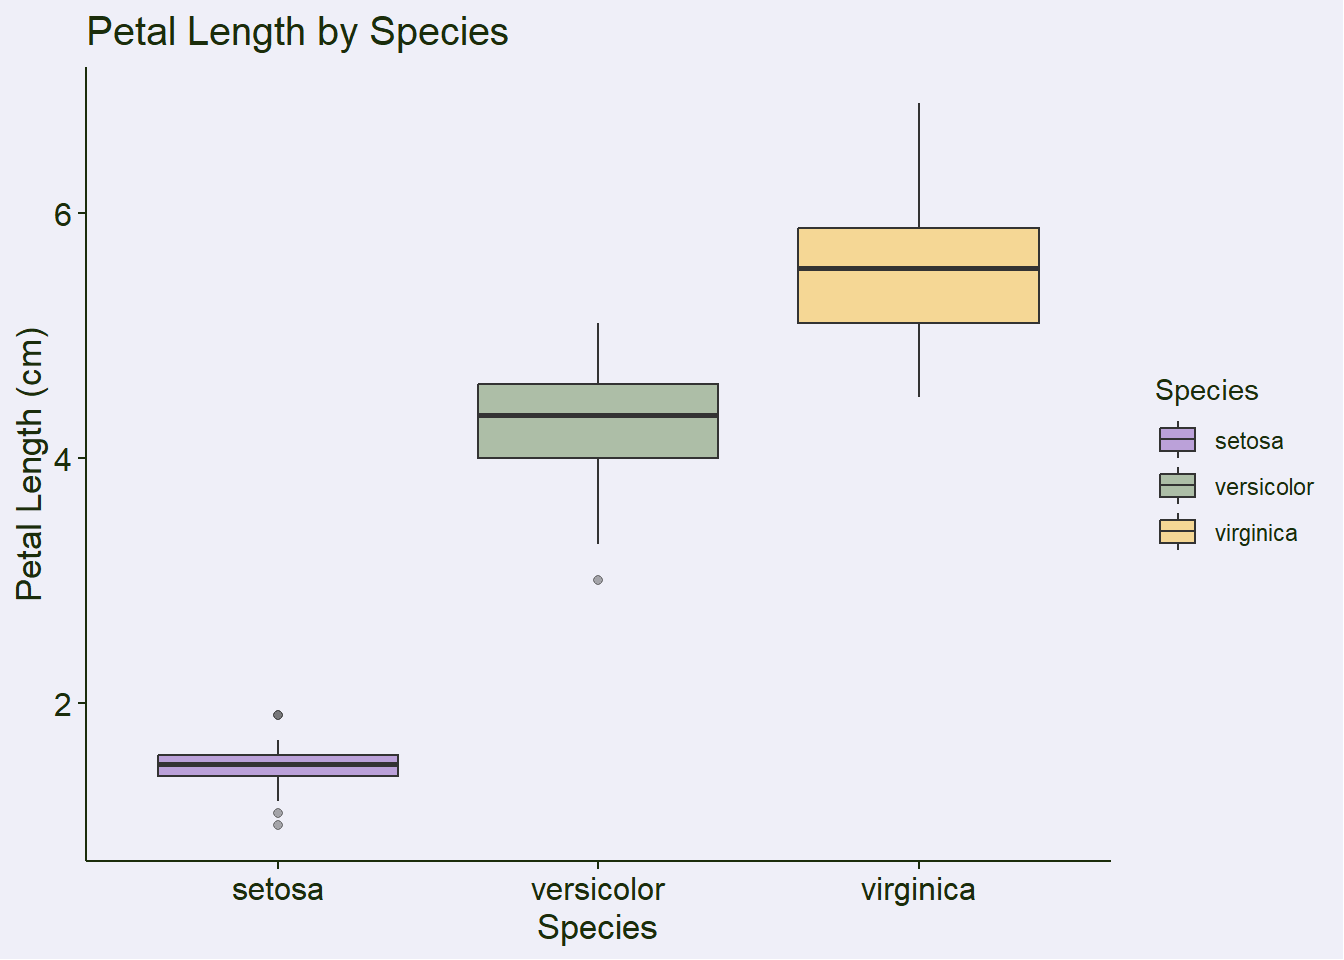
Next, let’s examine the petal length. Here, the differences between species are even more pronounced, with setosa having much shorter petals.
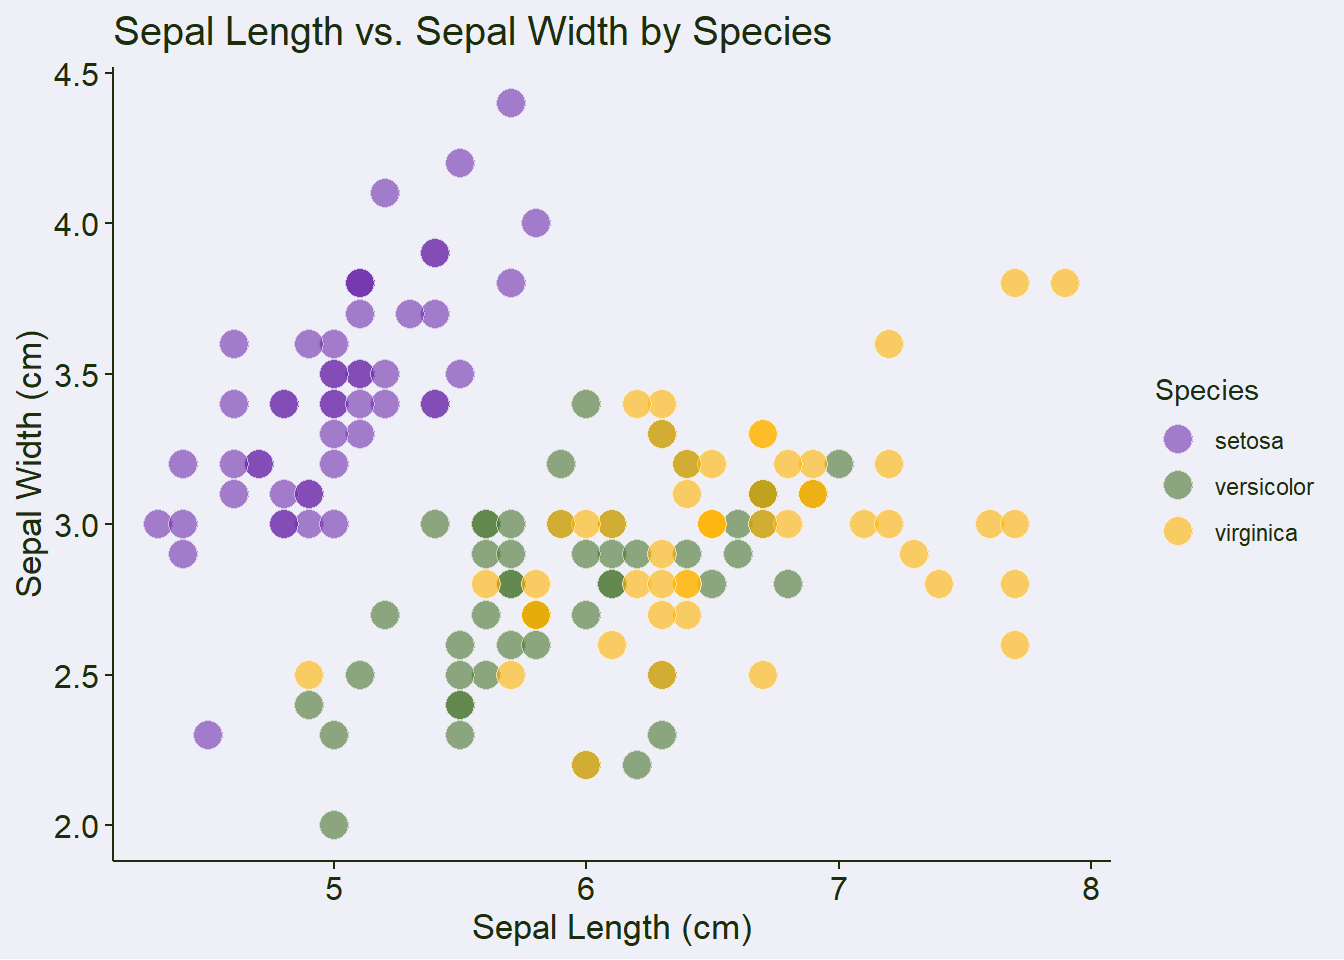
Now, let’s look at the relationship between sepal length and sepal width, colored by species. We can observe some clustering, particularly for setosa.
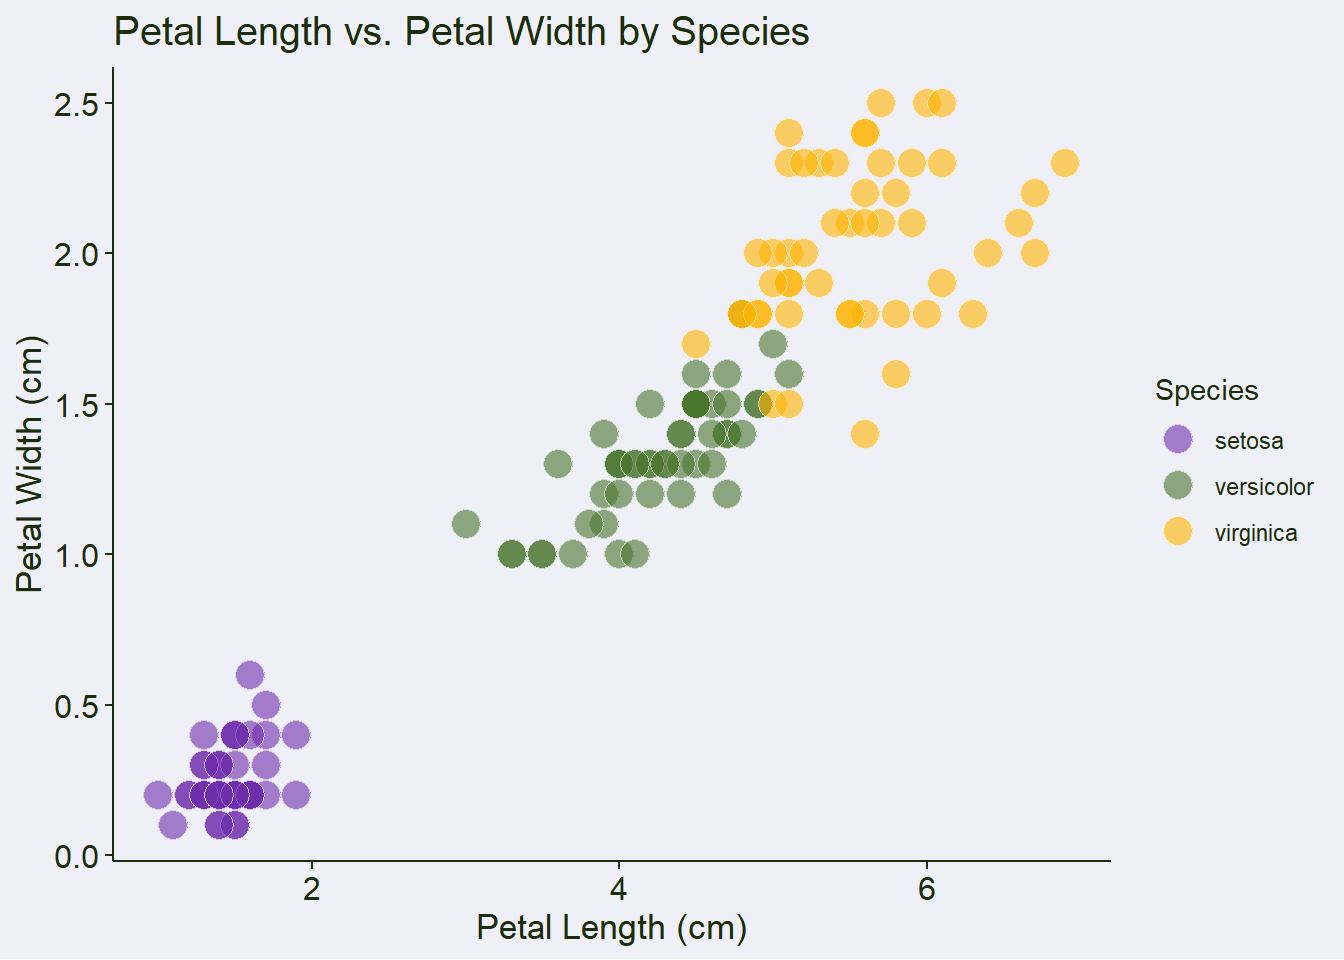
Finally, let’s visualize the relationship between petal length and petal width. This plot clearly shows three distinct clusters, making it easy to separate the species based on these two features.
This exploration demonstrates how the Iris dataset, despite its simplicity, provides a great foundation for understanding data visualization and basic machine learning concepts.